How to Measure AI Citations: 5 GEO Metrics for Your CFO

Most GEO programmes cannot answer the one question a CFO asks: what did we get for the money? Polaris Market Research calls attribution the biggest gap in the field. The fix is five metrics, measured monthly, on a one-page report finance already understands. This guide defines each metric, gives a copyable template, sets out the GA4 setup, and is honest about what AI-search measurement does and does not prove.
Why GEO Measurement Fails the Finance Test
Marketing buys a GEO programme. Three months in, the finance director asks what changed. The agency shows a dashboard full of citations. The CFO asks what that is worth. Silence. This is the most common failure in the field, and it is a measurement problem, not a delivery problem.
Polaris Market Research names return on investment and attribution as the biggest gap in most GEO programmes. Every educational piece admits measurement is hard. Almost none publishes a formula. Tools sell dashboards by the dozen. Nobody owns the methodology that turns a citation count into a number finance will sign off.
The gap exists because GEO borrowed SEO’s habits without SEO’s last-click tracking. AI search is partly a zero-click channel. A clean dashboard is not the same as a defensible report. The rest of this guide is the report we actually use with clients.
The Five Metrics That Survive a CFO Review
A CFO does not need forty data points. They need five, each tied to a business question, each trended over time. Here is the set we report for every client, with the data source for each and what it proves to finance. Review-platform presence is one of the strongest levers on these numbers, covered in the Trustpilot and G2 citation analysis.
| Metric | What it measures | Data source | What it proves to finance |
|---|---|---|---|
| Citation count per engine | Times your brand is cited, split by ChatGPT, Perplexity, Gemini, Claude, AI Overviews | Engine scans / AI visibility tools | AI search can find and quote you |
| Citation share of voice | Your citations as a % of all citations for your priority prompts | Engine scans across a competitive set | Your position versus named competitors |
| AI referral traffic | Sessions, conversions and revenue from AI engine referrers | GA4 custom channel | The click-through revenue AI sends today |
| Branded-prompt frequency | How often people ask AI engines about you by name | Prompt sampling / brand-tracking tools | Demand and brand pull, the zero-click signal |
| Source-stability index | How steady your citations are month to month | Your own monthly readings | Whether the gains are durable or volatile |
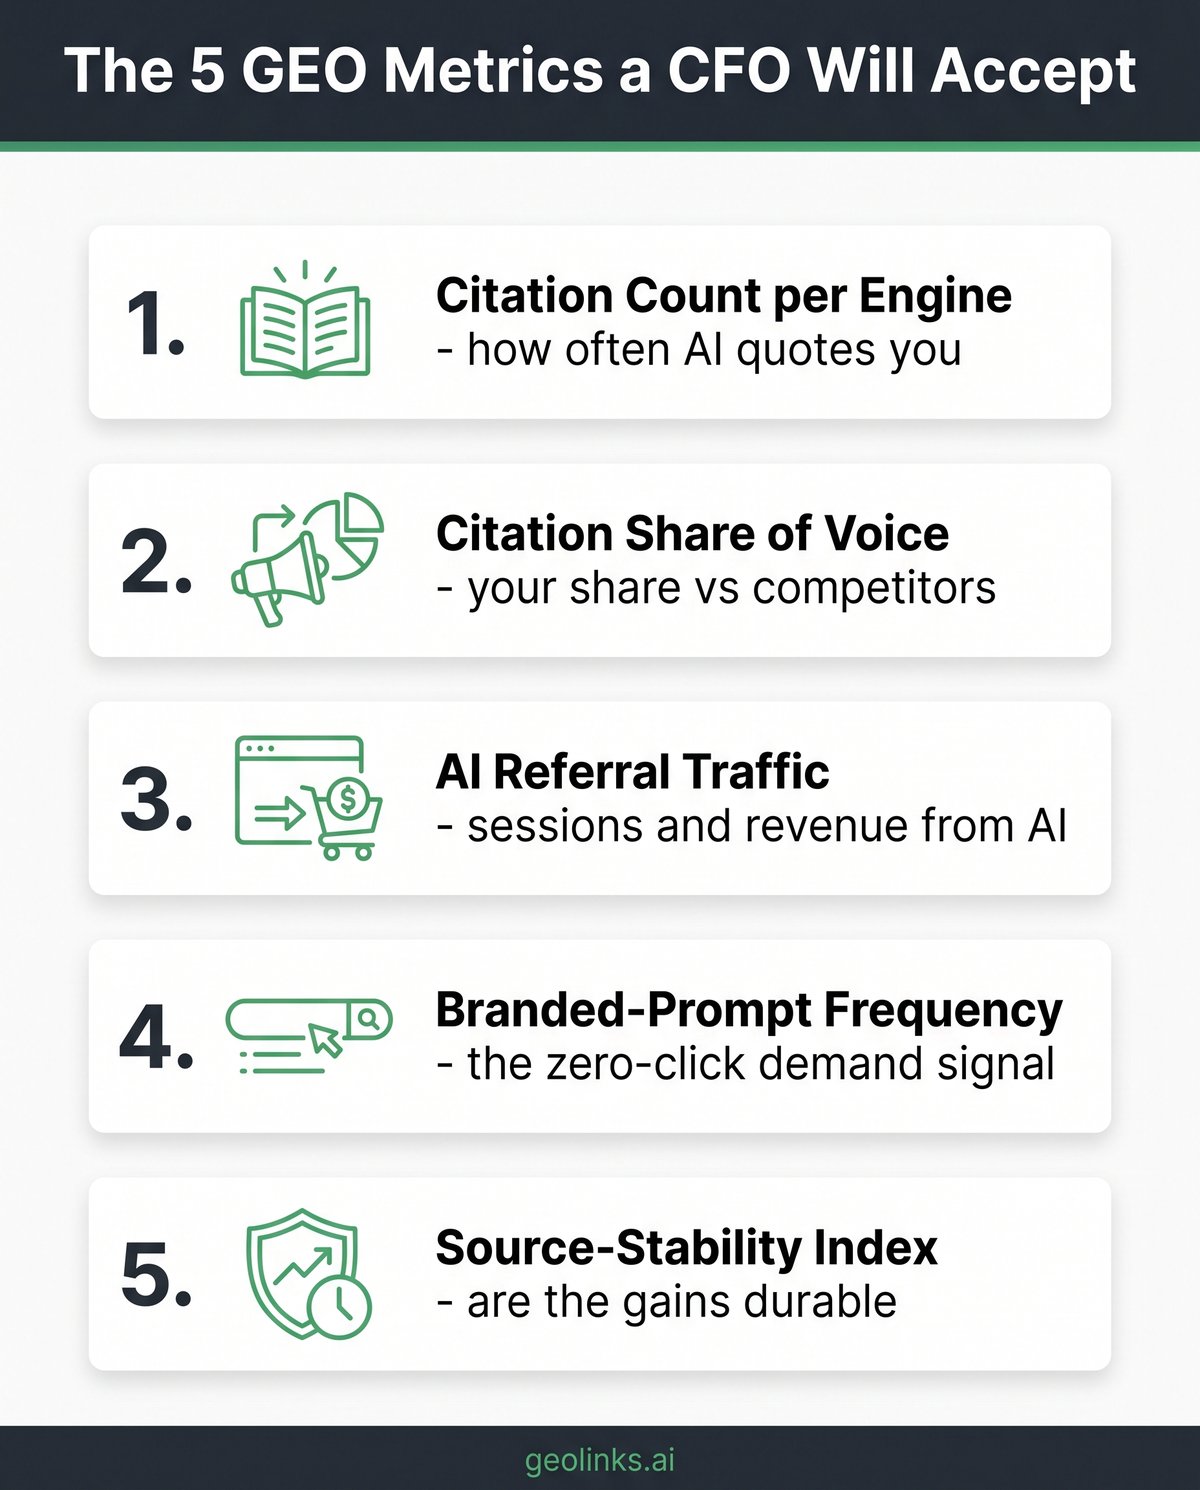
Report all five on the same page, every month, with the prior reading beside each. The trend matters more than any single value. A board can act on five trended numbers. It cannot act on a screenshot of a tool.
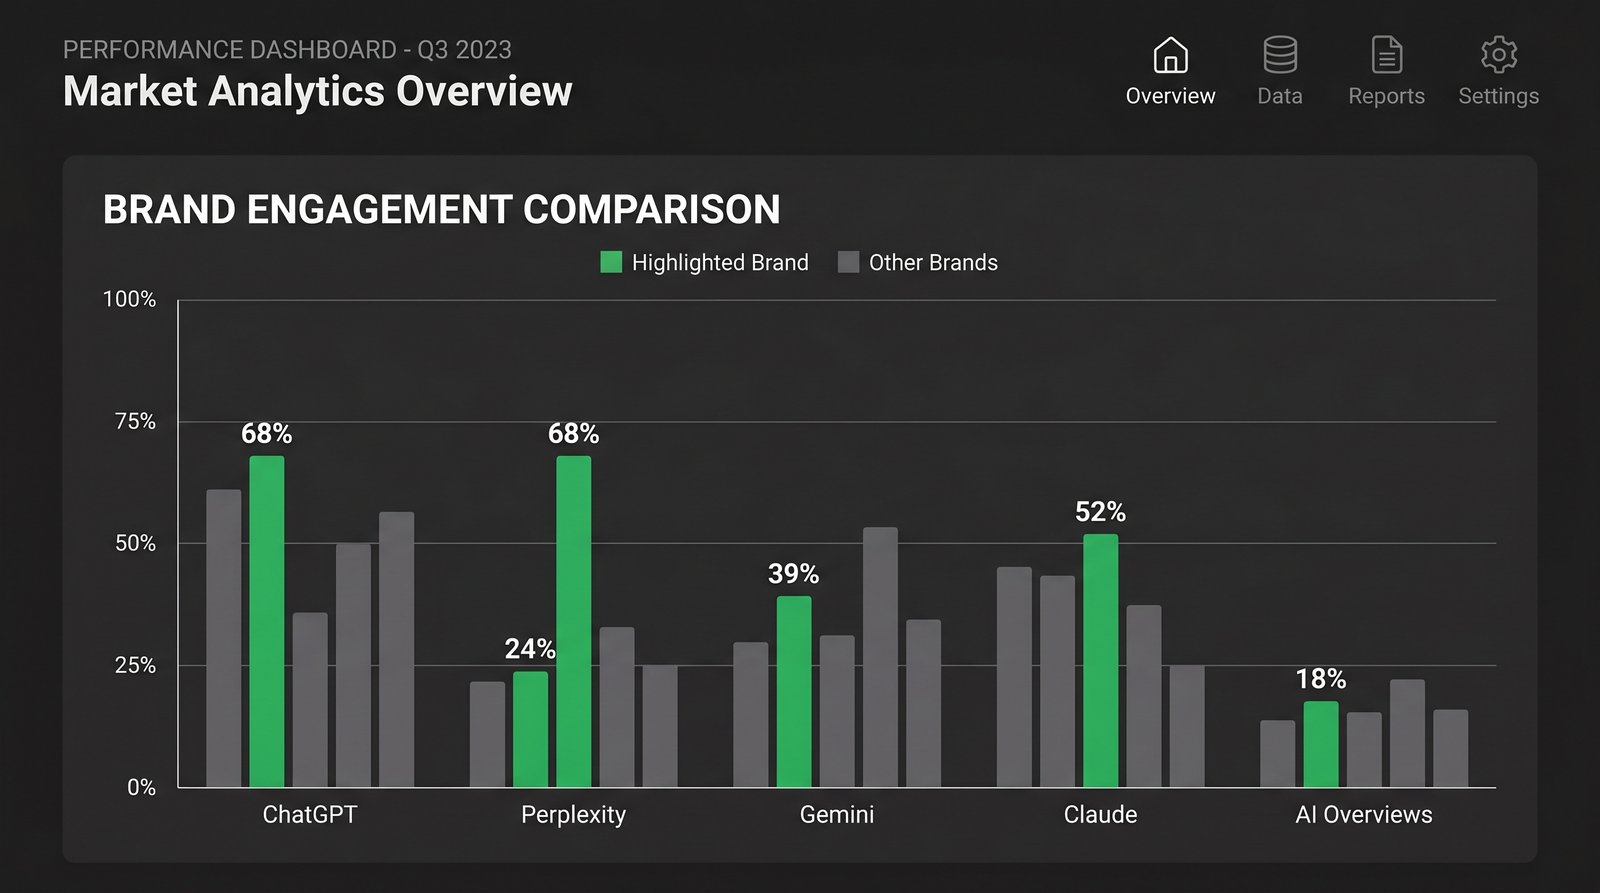
Citation Share of Voice: The One Finance Gets Instantly
Citation Share of Voice is the metric a CFO grasps in one sentence: it is market share for AI answers. Take your priority prompts, the questions a buyer would actually ask an AI engine. Run them across all five surfaces. Count every brand cited in the answers. Your share is your citations divided by the total.
Worked example. Ten priority prompts produce thirty brand citations across the engines. Four of those are yours. Your Citation Share of Voice is 13%. Your nearest competitor sits at 27%. That single comparison focuses a board faster than any raw citation count.
Track it per engine as well as overall. A brand can hold 40% share in Perplexity and 5% in AI Overviews. That split tells you exactly where next month’s work should go. Moving the number is a separate task, covered in the 9-point ChatGPT citation playbook.
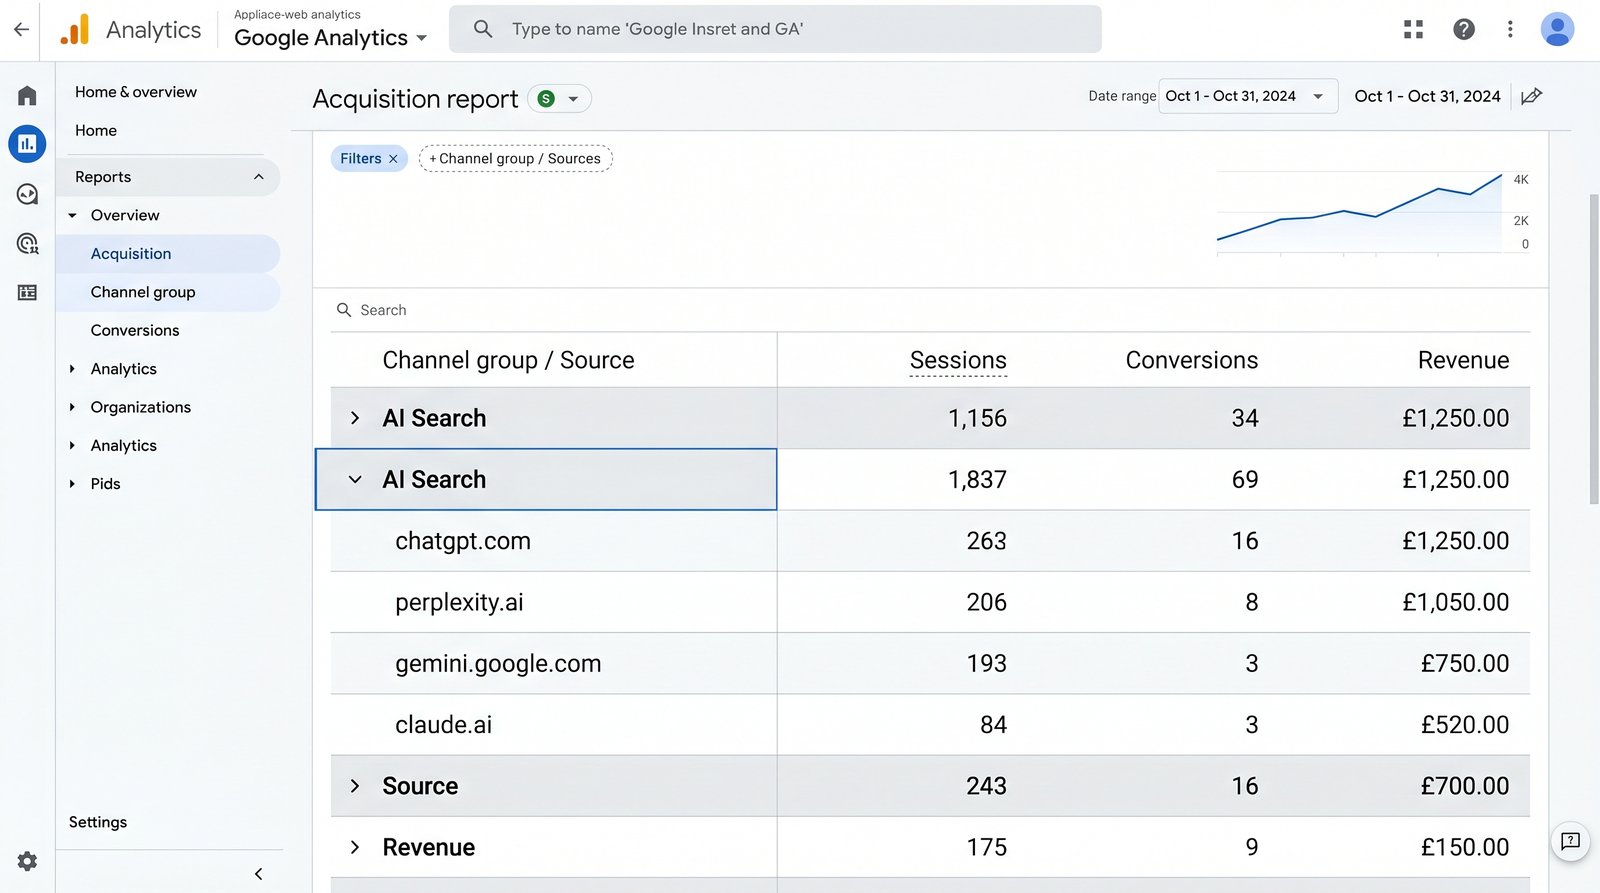
Setting Up GA4 to Track AI Referral Traffic
AI referral traffic is the one metric in the set that ties directly to revenue GA4 can confirm. AI engines pass a referrer when someone clicks through from an answer. By default GA4 buries these inside Referral or Unassigned. You separate them with a custom channel group.
Create a channel named AI Search. Match the session source against the engine hostnames: chatgpt.com, perplexity.ai, gemini.google.com, claude.ai, copilot.microsoft.com, and the openai.com referrer. Once the channel exists, AI search becomes its own line in acquisition reports, with sessions, conversions and revenue beside organic and paid.
This is the number finance trusts most, because it behaves like every other acquisition channel. It is also only half the story. The click-through it captures is real. The zero-click demand it misses is covered by branded-prompt frequency, reported separately so neither line is overstated.
The Source-Stability Index, and Why One Snapshot Lies
A single citation snapshot lies. AI engines re-roll their answers as retrieval updates, so the same prompt can cite you on Monday and skip you on Friday. The source-stability index turns that volatility into a number finance can read.
Method: take your priority prompts, run them on the same day each month, and record the percentage that still cite you versus the previous reading. Three months of data gives you a stability score. A brand cited in 80% of prompts one month and 30% the next has a presence problem dressed up as a win.
Stability matters because it separates durable gains from noise. We do not report a citation as banked until it survives two consecutive monthly readings. That one rule stops a lot of premature victory laps, and it is the reason citation order no longer tracks domain authority, as the drop to r=0.18 below rank five shows.
The Monthly GEO Reporting Template
The report finance signs off is one page, not a dashboard login. It carries the five metrics, the prior month, the change, and a one-line note on each. Copy the structure below and fill it in monthly.
GEO PERFORMANCE - [Month YYYY]
Prepared by [name] | Engines scanned: ChatGPT, Perplexity, Gemini, Claude, AI Overviews

1. Citation count (all engines):  [n]   (prev [n], change [+/-%])
2. Citation share of voice:       [n]%  (prev [n]%, top competitor [n]%)
3. AI referral traffic:           [n] sessions / [n] conversions / £[n] revenue
4. Branded-prompt frequency:      [n] per period   (trend: up / flat / down)
5. Source-stability index:        [n]% of citations held vs last month

Spend this month: £[n]      Cost per banked citation: £[n]
One thing we changed:  [single sentence]
Next month's priority: [single sentence]
Two lines carry the most weight with finance. Cost per banked citation turns the whole programme into a unit economic. Next month’s priority shows the spend has a plan behind it, not a hope.
What a GEO Report Does and Does Not Prove
Honesty here protects the relationship. A GEO report proves three things well: presence, trend and competitive position in AI search. It shows whether engines find you, whether that is improving, and how you rank against named rivals.
It does not prove direct last-click ROI to the penny. AI search is partly a zero-click channel. Someone reads your brand inside an answer, forms an impression, and buys a week later through a branded search. GA4 logs that as direct or organic brand traffic, not as AI search. Any agency claiming exact AI-search ROI is overstating what the data allows.
Report it the way finance already reports brand and PR: leading indicators of demand, shown next to the click revenue GA4 can confirm. The economics behind that demand are set out in the AI citation maths breakdown. That framing survives scrutiny. The inflated version does not.
How We Report It: Two Live Examples
Two examples from our own portfolio show the metrics moving together. Both are real client outcomes, reported on the template above, not projections.
Garden Ornaments arrived with 727 monthly organic visits in October 2025. Seven months of citation and content work took that to 6,370, a 776% rise, with no new referring domains added. The growth came from the citation layer, not classic link authority, which is exactly what the share-of-voice and stability metrics were built to track. The full numbers sit in the Garden Ornaments case study.
Garden UK started from a cold domain. It reached a Domain Rating of 15 from zero, grew referring domains from 27 to 149, and earned ten ranking keywords inside 30 days. Reported monthly, the curve was visible by week four. The Garden UK case study carries the detail. Neither result would have been defensible to a CFO without the five metrics behind it.
Where to Start
Measurement comes before spending. The free AI Visibility Check scans ChatGPT, Perplexity, Gemini, Claude and AI Overviews in under five minutes and gives you month zero of the template. Run it first at /check/.
If the baseline shows a gap, the monthly GEO plans report these five metrics as standard, on the one-page format above. Published pricing sits on the pricing page, with no minimum term and no mandatory call. The template, the metrics and the honesty about what they prove are the same whether you run them in-house or hand them over.
A metric a CFO accepts is the difference between a renewed GEO budget and a cancelled one. Build the report before you need to defend the spend, not after the question lands.